[Article by Wiida Fourie-Basson]
Engineers and scientists from Stellenbosch University have developed a visualisation tool that can automatically localise and quantify specific cellular processes such as mitochondrial fission and fusion – and that in three-dimensional space and time.
Mitochondria are organelles that generate most of the chemical energy needed to power the cell’s biochemical reactions. Mitochondrial processes, such as fission and fusion, therefore play a central role in the balance, function and viability of cells. When things go wrong, it is often a sign of the onset of neurodegenerative diseases such as Parkinson’s and Alzheimer’s disease.
To date, however, the accurate quantification of these cell dynamics has been a challenge, with most of the work being done manually.
Prof Ben Loos, a physiologist in the Department of Physiological Sciences, says they are very excited about this work: “We believe it moves the field forward on many fronts, from life sciences dealing with mitochondria and microscopy, to the fields of image analysis and object recognition, computation and machine learning, data handling and analysis, and 3D visualisation.
Since 2015, he has been working with Prof Thomas Niesler from the Department of Electronic and Electrical Engineering on improving 3D visualisation tools associated with microscopy. The current tool, called the Mitochondrial Event Localiser (MEL), was developed by Dr Rensu Theart as part of his PhD research into the virtual reality visualisation and analysis of microscopy data.
Prof Loos says image analysis of biological data is often so time consuming that only few research groups embrace such a task: “With MEL, we are able to quantify the structures and the interaction (fission and fusion) between the structures in the cell, as well as pin-pointing where these are occurring.
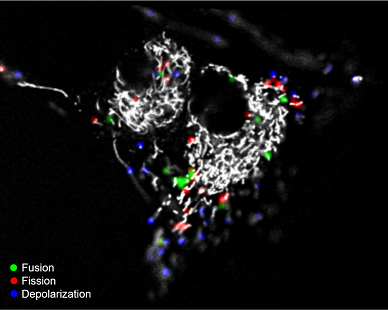
“This is incredibly exciting, to locate where in the cell fission, fusion and depolarisation occurs, and to quantitatively describe their magnitude of occurrence”.
Why is this so important?
He says researchers struggle to interpret the morphology of the mitochondrial network: “Some say that a highly networked mitochondrial structure indicates improved cellular health, other evidence suggests that it is the beginning of a stress response. The same for a fragmented mitochondrial picture, some scientists advocate that fragmentation equals stress and detriment, while other evidence indicates it as adaptive mechanism to enable mitochondrial quality control.
“This really bothered us. Especially since this plays such an important role in neurodegenerative disease, we wished to come up with a tool that could describe the mitochondrial network dynamically, meaning to work with real-time data sets. In doing so, a completely new data set is generated, which allows to showcase the state of equilibrium of mitochondria between a fission and a fusion state.”
They believe this software tool will be of major benefit to the research community dealing with mitochondrial dysfunction. Especially those laboratories focussing on Alzheimer’s disease and Parkinson’s disease.
“It could also become part of a diagnostic tool, if integrated into so called high throughput imaging platforms. And because mitochondrial depolarisation is a critical part in the beginning of cell death, there may be an even wider application base,” he concludes.
Information box: How does MEL work?
- First, a time-lapse sequence of a cell, labelled for mitochondria, is acquired in 3D with confocal microscopy.
- This time-lapse sequence is then pre-processed to ensure the best image quality and consistency between the frames in the sequence.
- Two consecutive frames are then chosen, and binarized. From this the separate mitochondrial structures can be extracted.
- Through various mathematical steps, including a new algorithm called “back-and-forth structure matching”, the presence and location of the mitochondrial events can be determined.
- These locations are then overlaid as different colours on the original mitochondrial image.
- This process is then repeated for all consecutive image pairs in the time-lapse sequence, thereby allowing a quantitative evaluation of how the mitochondrial events vary over time.
- Compiled by Dr Rensu Theart
The article “Mitochondrial event localiser (MEL) to quantitatively described fission, fusion and depolarisation in the three dimensional space” was published in the journal Plos One recently and is available online at https://doi.org/10.1371/journal.pone.0229634
The code that implements MEL is available for download at https://github.com/rensutheart/MEL

This is the result produced by the Mitochondrial Event Localiser (MEL) when applied to an image showing only the mitochondrial network of a cell acquired by confocal microscopy. The different colours indicate the location of where the mitochondrial fission, fusion, and depolarisation events were detected. Image: Rensu Theart
Contact details
| Prof Ben Loos
E-mail: bloos@sun.ac.za |
Dr Rensu Theart
E-mail: rptheart@sun.ac.za |
Prof Thomas Niesler
E-mail: trn@sun.ac.za |


